DIGC1200: Documenting The Process
Overview
Inspired by Zeynep Tufecki’s TED discussion of the dystopian infrastructure of data collection and weaponization, I wanted to build a representation of a real-world example of this. A visualization of how common, yet unaware we often are of the digital footprints we leave in the world. To do this, I wanted to think of something incredibly normal. Something we all do. Something highly relatable. So I chose the framework of a typical day where we get up, go to work, come home, watch television and go back to bed. This not only gave the work the structure and sequencing of time, but also allowed me to be able to pick out individual ‘moments of gathering’ where data is being harvested from users in the most mundane of moments. Driving home from work, I knew I needed a crisp title to be able to articulate this. This is where the play on words of ‘The Typical Data Day’ comes from, a playful adjustment of day-to-day of course.
My project matters to me because it's a problem I live in my work at NBC News. We are deeply mission-oriented in our sense-making of the world for the millions of users who use our products every day, but not immune to the market forces of needing to generate the necessary revenue to sustain our journalism. We are having conversations about persuasion architectures and dark patterns of coercion all the time. But by sharing my experience, and leaning on a typical, curious and thought-provoking set of circumstances, I am hopeful I will be able to foster a healthy digital dialog here with others.
The work below describes my process, and some of the steps I took to assemble my digital response. I hope you enjoy the work as much as I did in creating Tim’s world.

Recap: Podcasts + Materials Discussion: Thinking, Feeling, Believing
Inspired by Zeynep Tufecki’s discussion of the dystopian infrastructure of data collection and weaponization, I am going to build a representation of a real-world example of this process happening in the most normal of daily circumstances. A visualization of how common, yet unaware we often are of the digital footprints we leave in the world. To do this, I want to use something incredibly normal. Something we all do. Something highly relatable.
I'm going to use the framework of a typical day where we get up, go to work, come home, watch television and go back to bed. This will not only give the work the structure and sequencing of a timeline, but also allow me to be able to pick out individual ‘moments of gathering’ where data is being harvested from users in the most mundane of moments.
I am currently using the working title of The Typical Data Day.
Through the format of an interactive choose-your-own adventure online experience, users will be encouraged to think critically about the common moments throughout their day in which digital information about them is being shared, often without their knowledge. From location, passwords and banking information to voice recognition, patterns of behavior and political orientation, the data harvested through persuasion architectures will be surfaced and explored.
My project will use the language and rhetoric of the digital everyday to surface a conversation about the nature and extent of the data we are sharing simply by being digitally connected. It will be visually shaped through artificial intelligence tools such as MidJourney and ChatGPT, and implement specific sequencing and pathing flows to produce different journeys through the day. I believe that for as much data as we consume through the day, we are also incredibly generous in the information we allow others to gather from us. It will be an open question for users to decide if such a trade is equitable.
My project will exhibit compassion and disciplined curiosity by extending a hand to the every day. By connecting to behaviors and ideas common to many of us. What it's like to wake up and reach for the smart phone. What it's like to order delivery food with an app. Or what it's like to want to watch just one more video on YouTube. But it will also ask the user to consider the dark patterns of persuasion all around us, and what it's like to be an active participant in their development. Do we play, or do we pass?
My project matters to me because it's a problem I live in my work at NBC News. We are deeply mission-oriented in our sense-making of the world for the millions of users who use our products every day, but not immune to the market forces of needing to generate the necessary revenue to sustain our journalism. We are having conversations about persuasion architectures and dark patterns of coercion all the time. But by sharing my experience, and leaning on a typical, curious and thought-provoking set of circumstances, I am hopeful I will be able to foster a healthy digital dialog here with others.
Assembling Script & Sequencing in Miro
This is where I did most of the ‘figuring out’ work. I initially mapped out the three large blocks of the day - morning, daytime and evening. From there I got more specific into individual moments we might want to call out such as eating, traveling, working or watching television. Then each individual moment was mapped to ideas of data gathering, and ultimately back to examples from the week’s materials. Finally, each moment was linked and adjusted into a sequence which became a script. This script was then used as content and combined with the MidJourney work below.
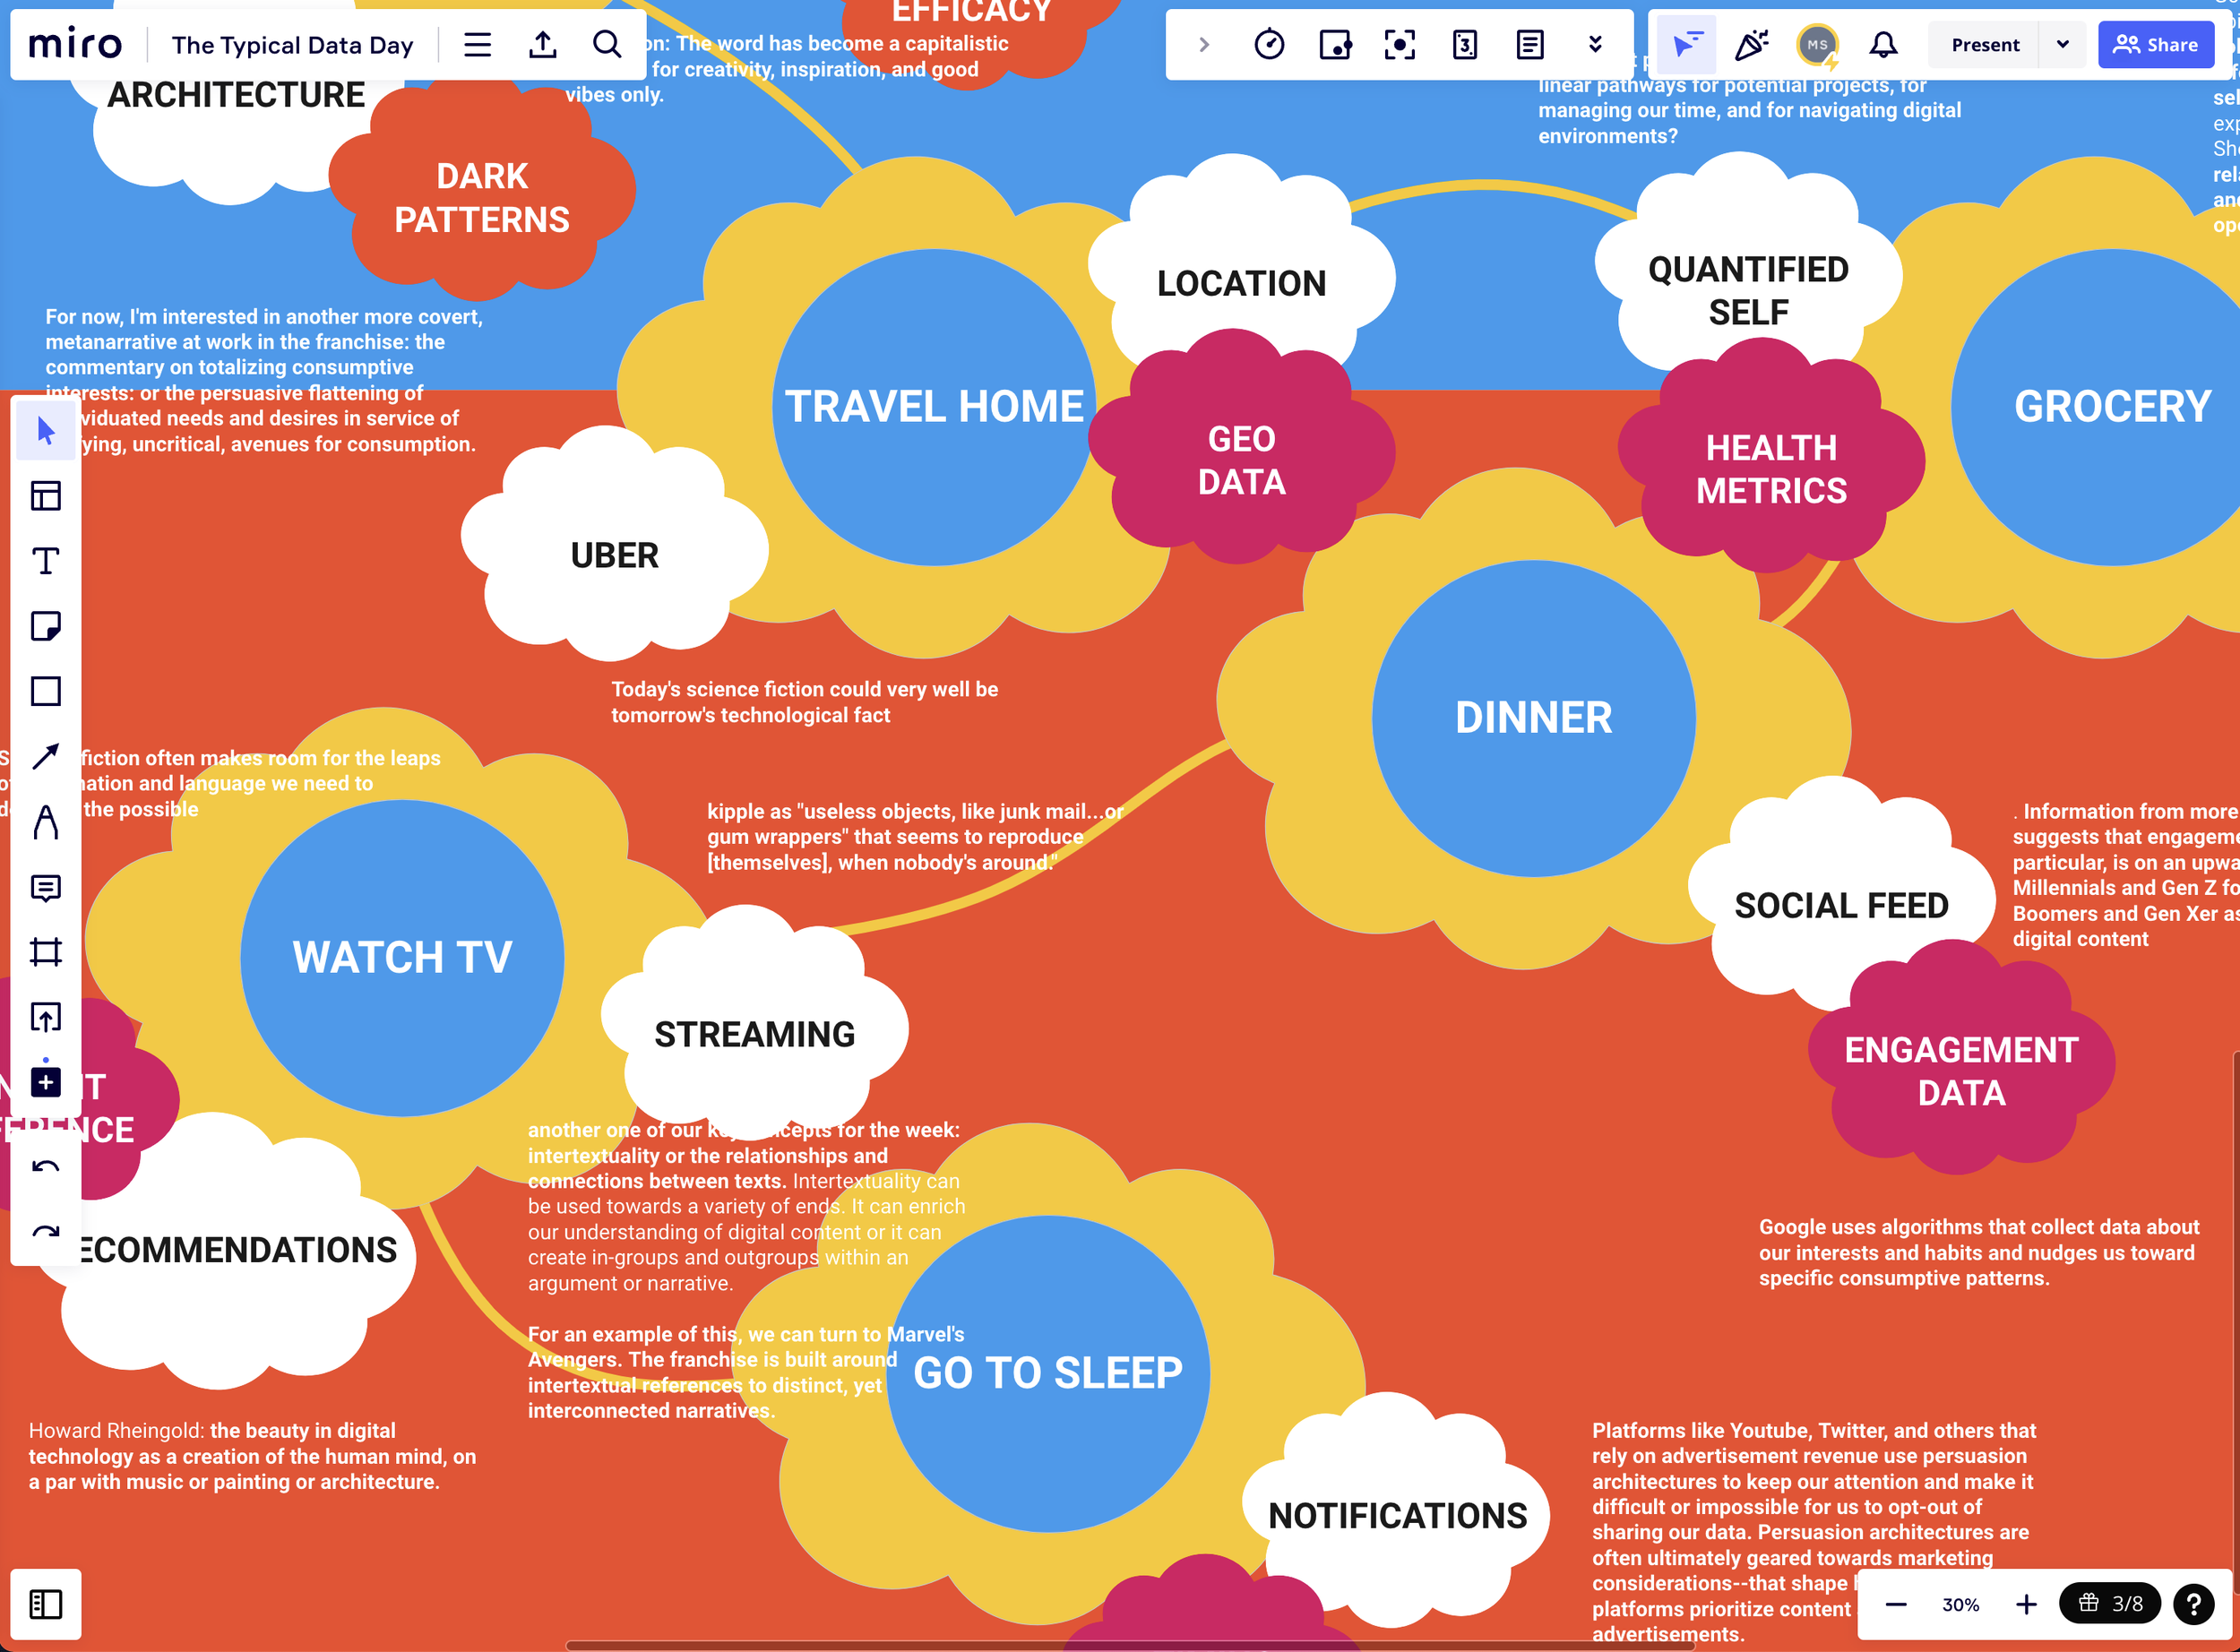
The main benefit of working this way was to be able to get a view of the entire day in one holistic perspective. It also afforded me the opportunity to map the content from the material to individual moments throughout the day, and see ‘this goes here, but also here’. Branching between choices wasn’t something which had appeared at this point (for example the choice we ask Tim to make about lunch), but this is more a view of the main beats which need to be covered, and how they might be supported with a conversation about data gathering.
Character & Scene Building in MidJourney
This was probably the most time-consuming part of the process, as there’s a tremendous amount of prompt iteration required to get these images to a sufficiently high, consistent standard. For the most part I was able to get very close on consistency, but the more observant among you will notice that Tim’s weight tends to fluctuate throughout the day. This is a particular challenge with MidJourney in being able to consistently replicate results, and something which is well illustrated here. However, I think many of the results are ‘close enough’. Below are some examples and prompts of the images I upscaled, but they sit on top of hundreds of failed iterations and experiments. Common MidJourney rendering errors such as hands with too many fingers, Tim not wearing glasses or his shirt being a different color (despite the prompt inclusion to do so) or just placing Tim in the wrong location were all examples of work discarded. The most challenging was getting Tim to look as if he was asleep - closing his eyes took a lot of time to get just right, and even in the final image I chose, his eyes are only half-closed. Also getting him to look as if he was laying in bed was very challenging, especially when I also wanted him to be looking at his phone. But with perseverance, I think we got there.
Why the Pixar styling? I wanted something which was familiar, highly relatable, not too serious, and inspired the surprise, curiosity, or joy being asked for in the assignment.


Prompt Examples
/imagine: Pixar-style slightly chubby 40 year old dad wearing glasses and a blue button-down shirt from the movie Inside Out eating dinner and watching television --ar 16:9
/imagine: Portrait of two Pixar-style marketing executives presenting a chart in an office meeting --ar 16:9
/imagine: Pixar-style skinny 30 year old female barista wearing glasses and a rock band shirt from the movie Inside Out holding out a cup of coffee at Starbucks --ar 16:9
Editing in Photoshop & Adding Text
This is where I assembled the individual moments of Tim’s day. The steps involved are:
Select the best images per ‘moment’ from the library I’d made in MidJourney
Tidy up any artifacts from MidJourney in Photoshop
Pull in the key textual points from the Miro sequencing script and add them in Photoshop
Add in the examples of the data being gathered from Tim based on platforms and products being used
Add timestamp
Export the individual moments as 1980x1020 jpg files for ingestion into Stornaway


Research Into Platform Data Gathering Policies
In assembling the lists of data being gathered from Tim, I spent some time with the (often impenetrable) public data policies from the products Tim encounters. Here are links to some of the examples I used:
Amazon Alexa: https://www.amazon.com/b/?node=23608614011
DoorDash: https://medium.com/@DoorDash/data-at-doordash-transparent-ubiquitous-and-still-just-getting-started-acc598f2660c
Facebook: https://www.facebook.com/about/privacy/update/printable
Netflix: https://www.wired.co.uk/article/netflix-data-tracking-privacy
Starbucks: https://d3.harvard.edu/platform-digit/submission/the-perfect-blend-starbucks-and-data-analytics/
Uber: https://help.uber.com/riders/article/whats-in-your-data-download?nodeId=3d476006-87a4-4404-ac1e-216825414e05
YouTube: https://policies.google.com/privacy?hl=en-US
Assembling Interactivity in Stornaway
This is where I pulled everything together from the original Miro sequencing and the visual work in MidJourney / Photoshop into an interactive flowchart which was able to be published and interacted with. I’d never used Stornaway before, and discovered it from a simple ‘build your own choose your own adventure’ Google search. The product is freemium, but what I’m building here is simple enough not to require a purchase. I wanted the narrative through the day to be primarily linear, but with specific ‘moments of decision’ and moments where there’s a simulation of choice. The choice of what Tim has for lunch is an actual choice with different outcomes, whereas when Tim goes to bed is just a means of jumping around in the timeline. The main ‘moment’ is the humor of Tim’s meeting with the Marketing department, when there’s no choice at all, but there’s an obvious point being made about the nature of dark patterns here.


Validating & Exporting
This is a really important part of the process, and required a fair amount of iteration. It’s one thing to build something, but it’s another to ship it safely out into the world without breaking. Thankfully Stornaway has a debugging tool to help users validate their sequences, and it surfaces things which need to be addressed prior to publishing. An absolutely invaluable tool, and another reason why I chose Stornaway. This step also helps me understand how the work appears on the desktop web and on mobile devices, and if any adjustments need to be made. The project is primarily created for desktop experiences, but is robust enough on the phone.

Publishing
This is the final step in the process, the public distribution of the work. This is primarily done two ways: A self-contained URL, and an embed code. The self-contained URL will take users to a web page with the project on it, the embed code is what you see below where I can have the work appear inline on my own site.
Things Which Could Be Improved
A soundtrack over everything to pull the entire experience together (I experimented with trying to generate some Ai music, with little success)
A voiceover of me talking through everything, but based on an Ai model trained on my voice and reading from a script
A more consistent depiction of Tim
More branching and decision-making moments
Better integrated typography for the decision buttons (I couldn’t figure out how to change these, even at the paid subscription level in Stornaway)
I hope you enjoyed spending time with Tim! Let’s give the last word to Doctor Tufecki:

Peer Review Feedback-Based Adjustments

From Taylor: “I might add in a spot for hobbies or a part of the day that is not always in tune with everyones day-to-day. This could be a gateway for more personalized data collection and how this can get vary particular in terms of what "they're" learning about you. For example, walking the dog, going to the gym, golfing, sports, gaming, etc. “
References:
ChatGPT (2023). Write a sample mad-lib style welcome greeting to encourage a returning customer to follow us on social media in order to be entered into our competition. “Welcome back [Customer Name]! Thanks for shopping at [Local Store Branch Name]. Don’t forget to follow us on '[Social Platform] to enter into our [Insert Discount] grand giveaway!
Colmon, C. (2023a). DIGC 1200 Podcast: Episode 1 - Critical Consumption - (5:22 minutes). The University of Pennsylvania. [Digital Audio File]. Retrieved from https://canvas.upenn.edu/courses/1711611/pages/digc-1200-podcast-episode-1-critical-consumption-5-22-minutes?module_item_id=26672520.
Colmon, C. (2023b). DIGC 1200 Podcast: Episode 2 - Future Shock - (5:04 Minutes). The University of Pennsylvania. [Digital Audio File]. Retrieved from https://canvas.upenn.edu/courses/1711611/pages/digc-1200-podcast-episode-2-future-shock-5-04-minutes?module_item_id=26672521.
Colmon, C. (2023c). DIGC 1200 Podcast: Episode 4 - Electric Sheep - (6:58 Minutes). The University of Pennsylvania. [Digital Audio File]. Retrieved from https://canvas.upenn.edu/courses/1711611/pages/digc-1200-podcast-episode-4-electric-sheep-6-58-minutes?module_item_id=26672523.
Colmon, C. (2023d). DIGC 1200 Podcast: Episode 5 - Rhetorical Consumption - (8:38 Minutes). The University of Pennsylvania. [Digital Audio File]. Retrieved from https://canvas.upenn.edu/courses/1711611/pages/digc-1200-podcast-episode-5-rhetorical-consumption-8-38-minutes?module_item_id=26672541.
Colmon, C. (2023e). DIGC 1200 Podcast: Episode 7 - Media Mania - (6:48 Minutes). The University of Pennsylvania. [Digital Audio File]. Retrieved from https://canvas.upenn.edu/courses/1711611/pages/digc-1200-podcast-episode-7-media-mania-6-48-minutes?module_item_id=26672543.
Colmon, C. (2023f). DIGC 1200 Podcast: Episode 8 - Persuasive Architectures - (8:38 Minutes). The University of Pennsylvania. [Digital Audio File]. Retrieved from https://canvas.upenn.edu/courses/1711611/pages/digc-1200-podcast-episode-8-persuasive-architectures-8-38-minutes?module_item_id=26672544.
Colmon, C. (2023g). DIGC 1200 Podcast: Episode 3 - Location, Location, Location - (8:12 Minutes). The University of Pennsylvania. [Digital Audio File]. Retrieved from https://canvas.upenn.edu/courses/1711611/pages/digc-1200-podcast-episode-3-location-location-location-8-12-minutes?module_item_id=26672522.
Eyman, D. (2015). Defining and Locating Digital Rhetoric. University of Michigan Press.
McMillan Cottom. T. (2019). Think on This: Tressie McMillan Cottom. YouTube. [Digital Video File]. Retrieved from https://www.youtube.com/watch?v=tJbxuzizKp8.
Roose, K. (2020). Rabbit Hole, One: Wonderland. The New York Times. [Digital Audio File]. Retrieved from https://open.spotify.com/episode/7GP4kaqyGbPz3CrvkTcBRx?si=WMgEteUJQn-wDagTSrDh8g&nd=1.
Tufecki, Z. (2017). We're building a dystopia just to make people click on ads. TED Global. [Digital Video File]. Retrieved from https://www.ted.com/talks/zeynep_tufekci_we_re_building_a_dystopia_just_to_make_people_click_on_ads?language=en#t-35326.
Urban, T. (2016). Tim Urban: Inside the mind of a master procrastinator | TED. YouTube. [Digital Video File]. Retrieved from https://www.youtube.com/watch?v=arj7oStGLkU.